

The 10 Most Popular Counties to Move to in the UK 2021
Find out if your ideal location is in the top 10 most flocked to UK counties…
With the housing market making a resurgence after a tumultuous 2020, the UK has since experienced rapid growth thanks to thousands of homeowners looking to relocate to a different part of the country.
A study from Bird & Co has uncovered the UK's most sought-after locations, having analysed June 2021 figures from the Office of National Statistics, HM Land Registry and Rightmove, amongst several other reputable sources.
Within each region, the study breaks down the stats by local authority, including statistics on:
- Net internal migration: the inflow of people moving to the region minus the outflow.
- Property transactions: the number of title changes for the properties in the region.
- Loyal homeowners: the minimum percentage of property transactions that involved people already living in the region i.e. current local residents buying new properties within the region.
- Dwellings that have changed hands: the percentage of property transactions in relation to the total number of dwellings in the region.
- House prices: the average house price in the region.
The results showed some clear trends while throwing up a few surprises. Devon and Norfolk pipped the home-counties to the post for first and second place, reaffirming a change in attitude from homeowners who are now looking to escape the densely populated regions in favour of a more peaceful way of life.
Other winners included Midlands counties with large universities drawing in the younger population, and more rural places, such as Cornwall and West Sussex; the only two regions with local authorities dominated by elderly migrants.
So, whether you're thinking of relocation, or are big on hometown pride, read on to find out where the UK's most popular counties are this year…
1. Devon
- Net internal migration: 8,521
- Total number of home transactions: 48,311
- Average % of loyal homeowners: 82.72%
- Average % of dwellings that changed hands: 12.74%
- Average house price: £311,975
- Migration age: mainly above 50, although some outliers, including Exeter at 15-19
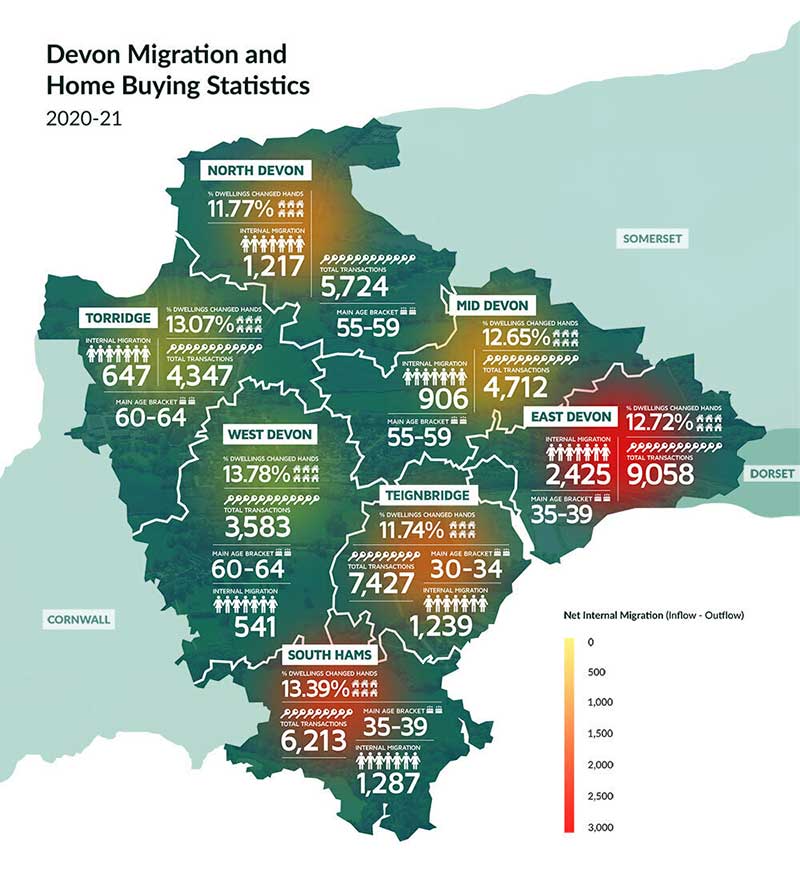
Known for its stunning beaches and bustling historic cities, Devon is the region that has experienced the most migration out of all regions in the United Kingdom.
Perhaps due to its capacity, East Devon is by far the most flocked to area of the region, receiving a net migration rate of 2,425 persons in the past year.
East Devon also had the highest number of transactions, suggesting people in this area tend to move a lot as opposed to those in Exeter - a town that upholds an impressive stat of 96.43% of people staying within the region.
Interestingly, the main age brackets that move to Devon comprise of 35-39-, 55-59- and 60-64-year-olds, a statistic that is overall much higher than that of other regions. These findings suggest that middle-aged homeowners are moving to the region, either to downsize or retire.
2. Norfolk
- Net internal migration: 7,181
- Total number of home transactions: 51,890
- Average % of loyal homeowners: 83.40%
- Average % of dwellings that changed hands: 12.03%
- Average house price: £293,286
- Migration age: predominately 20-24, but overall, quite mixed
Situated on the east coast of England, Norfolk has over 90 miles of unspoilt coastline, forests, nature reserves and picturesque market towns. This year, it soared ahead of Kent, Essex, Derbyshire, Leicestershire, Warwickshire and Cornwall, who beat it in the previous year.
The most popular region of Norfolk appears to be South Norfolk, with over 2,345 people migrating to the area in the past year. Norwich had more people leaving the town than it did moving in, a rather surprising stat until you consider its dense student population who were unable to attend the university during the pandemic.
South Norfolk had the highest percentage of transactions to the number of properties in the area, while homeowners in North Norfolk had the least. This is likely due to the difference in age ranges, with South Norfolk having a younger migrant population (predominately 20-24-year-olds) than that of the North (primarily 60-64-year-olds).
3. Hampshire
- Net internal migration: 6,334
- Total number of home transactions: 80,371
- Average % of loyal homeowners: 89.66%
- Average % of dwellings that changed hands: 13.28%
- Average house price: £386,613
- Migration age: mainly below 35, although some outliers, including New Forest at 65-69 and Havant at 45-49
The largest county in the South East, Hampshire, follows as the third most coveted UK place to live, and with its perfect blend of coast, city and country Hampshire, is it any wonder?
While most people are moving into East Hampshire and Eastleigh, it's Basingstoke and Deane that are experiencing an overwhelming number of property transactions, suggesting that residents living in the area are content with the location but not their current home.
The ages of people moving into the region seem to vary, with the eldest living in the New Forest and the youngest living in Winchester.
4. Kent
- Net internal migration: 6,269
- Total number of home transactions: 96,568
- Average % of loyal homeowners: 91.80%
- Average % of dwellings that changed hands: 14.12%
- Average house price: £408,554
- Migration age: mainly between 20-24, although some outliers, including Thanet at 60-64, Tunbridge Wells at 10-14, Canterbury at 15-19, and Dover at 30-34
Often referred to as the 'Garden of England', Kent borders London as one of the UK's most lucrative home counties.
According to the data, the most popular place to move is the county town of Maidstone, with a staggering 1,205 net having moved there in the last year, and a total of 10,459 transactions happening within the area. This is the largest transaction rate of all 10 counties, second to that of Basildon in Essex.
What’s more, Kent has the most loyal homeowners, with an impressive 93.72% not moving from the region, an interesting stat when you take into consideration the heavy influx of the younger generation (mainly 20-24-year-olds).
With its bustling towns, universities, idyllic orchards, and easy access to London, it seems that Kent is an up-and-coming county for first-time buyers wanting to get onto the property ladder.
5. Essex
- Net internal migration: 5,661
- Total number of home transactions: 87,184
- Average % of loyal homeowners: 90.66%
- Average % of dwellings that changed hands: 13.55%
- Average house price: £404,493
- Migration age: mainly below 24, although some outliers, including Braintree and Uttlesford at 30-34 and Tendring at 60-64
From the glitz and glamour of Brentwood to the breath-taking Blackwater salt marshes, and historical town of Colchester, Essex sneaks into the top five.
While Colchester and Chelmsford appear to have the highest number of transactions, it's Tendering and Uttlesford that homeowners are moving to. Interestingly, Uttlesford, with a large migration age of 30–35-year-olds, is seeing the most stagnant housing activity, after taking into consideration transaction numbers per dwelling.
In the past year, Harlow had more people leave the town than arrived, but those that have decided to stay have remained in the same home, with the lowest percentage of dwellings changing hands (11.69%).
6. Derbyshire
- Net internal migration: 5,631
- Total number of home transactions: 46,965
- Average % of loyal homeowners: 87.59%
- Average % of dwellings that changed hands: 12.64%
- Average house price: £233,861
- Migration age: mainly 20-24, although some local authorities with more migration from those in their 30s
Home to the Peak District and breath-taking Derbyshire Dales, Derbyshire is the first of only three counties outside of the South of England to make it onto the UK’s top 10 most sought-after locations.
As we make our way up to the Midlands, house prices begin to rapidly decrease. With an average house price of £233,861, you could buy a 3-bedroom detached property in Derbyshire for the same price as a 2-bed semi-detached property in Devon.
According to migration figures, South Derbyshire is the most popular area to move to within the county, with 2,016 people (net value) having relocated there in the past year. High Peak is the least popular area to move to within the county, having had a low net internal migration of just 57 migrants.
7. Warwickshire
- Net internal migration: 5,329
- Total number of home transactions: 35,770
- Average % of loyal homeowners: 85.37%
- Average % of dwellings that changed hands: 13.72%
- Average house price: £329,983
- Migration age: 20-24
Hailed for its links to Shakespeare, Warwickshire is perhaps one of the most historic of all entries and consists of theatres, cobbled streets, romantic canals, and a medieval Cathedral and Castle.
The most popular town would appear to be Stratford-on-Avon, despite Warwick tipping the numbers of properties in the area. Stratford has an impressive total net migration of 2,455, with Nuneaton and Bedworth at a low 415, holding the fort for the whole county, alongside Rugby, with net migration of 1,349.
Surprisingly, despite its historical undertones and beautiful scenery, it doesn’t seem to have a high population of retirees and is the only county to have a complete main migrant age population of 20–24-year-olds.
8. Lancashire
- Net internal migration: 5,260
- Total number of home transactions: 68,979
- Average % of loyal homeowners: 86.19%
- Average % of dwellings that changed hands: 12.53%
- Average house price: £191,573
- Migration age: predominately 20-24, but overall, quite mixed
Lancashire is the most northern location on our list and, whether you’re looking to catch a glimpse of wildlife at Morecambe Bay, see the coastal plains at Ormskirk, or visit the world-famous seaside town of Blackpool, this region has much to offer in terms of coastline and country.
As well as having a plethora of things to do at the region’s doorstep, Lancashire is by far the most affordable place to live out of all ten locations, with an average house price of £191,573. In the Southeast of England, you would struggle to get a one-bedroom flat for below £200,000.
From the data, it appears most people are flocking to Wyre, Ribble Valley and Flyde, and leaving Hyndburn, Pendle, Preston, and Rossendale. It has a relatively small influx of migrants for a county of its size but maintains a strong and active housing market due to the loyalty of its longstanding homeowners.
9. Cornwall
- Net internal migration: 4,935
- Total number of home transactions: 33,590
- Average % of loyal homeowners: 85.31%
- Average house price: £327,705
- Migration age: 70-74
Surrounded by beaches and with typically nicer weather, the UK’s most visited holiday destination, Cornwall, comes in at entry number nine.
With a total net migration of 4,935, and a dominant migrant age of 70-74, it’s clear that a lot of homeowners in the UK are seeking the most south-westerly region of the UK to relax and retire to.
Average house prices in this region vary from £235,624 for a terraced property, to £444,183 for a detached property. The picturesque county had an overall average house price of £327,705, similar but more expensive than that of nearby Devon that had an average price of £311,975.
10. West Sussex
- Net internal migration: 4,822
- Total number of home transactions: 51,708
- Average % of loyal homeowners: 89.26%
- Average % of dwellings that changed hands: 13.29%
- Average house price: £429,756
- Migration age: mainly below 40, although one outlier, including Arun at 65-69
Finally, West Sussex ends our top 10. Covering both coast and the South Downs National Park, this region has everything from hills, harbours, farmland, and market towns.
Its stately homes and striking beaches are a few reasons why it’s the most expensive place to live out of all entries, at a pricey average house price of £428,756.
Last year, Horsham received the greatest number of migrants, while Arun (9,990) had the highest transaction rate.
Let’s Get Relocating!
Whether you’re considering moving or are happy where you are, hopefully this list helped you decide where you’d like to live in the UK.
One thing is for sure, we live in a small but diverse and beautiful country, but population numbers are on the rise, as are house prices. So, if you’d like to get on the property ladder soon, now is your chance!
For more conveyancing advice about how to make the process of buying and selling a property smooth and efficient, visit Bird & Co’s website or call 01476 591711.
Data Collection
Data Sources:
- Internal Migration from Office for National Statistics
- Internal Migration Age Brackets from the Office for National Statistics
- Transaction Data from HM Land Registry
- Number of Dwellings from Ministry of Housing, Communities & Local Government
- House Prices from Rightmove
Methodology:
The data presented in this article has been taken from the Office National Statistics, HM Land Registry, Ministry of Housing, Communities & Local Government, and Rightmove.
All figures used in this study are as up to date as possible, generally taken from an official document published in 2021 or 2020. Time frames between sources may vary slightly, but all publication dates can be found via the link to each independent data source.
To figure out the percentage of 'loyal' homeowners in each region, we found the difference between the total number of transactions and the net internal migration, and divided the sum by the net transactions, so it is purely an estimate of the minimum value. When using the term loyal, we are referring to the number of people that already lived in the region and have remained there this year.
To work out the percentage of dwellings that had changed hands in each region, we divided the total number of transactions by the total number of dwellings.
Although this data was sourced via reputable sources, its interpretations are of the Bird and Co researchers.